Mapped: Top UK Import and Export Partners
An Analysis of the UK's International Trade
International trade has always been a very important factor for each country’s economic development, employment rates, and continuous supply of goods and services. In other words, trade contributes to more prosperous life of the country's citizens.
Therefore, Market Inspector looked into the UK’s exports and imports, which have always been of crucial importance for the UK economy. Through international trade, the UK is able to maintain its position in a highly competitive global economy.
To study the UK’s top trade partners Market Inspector used data from the UK’s Department for International Trade, published in October 2019. The study assessed the UK’s global trade partners, as well as EU partners. Furthermore, a more in-depth examination of the UK’s imports and exports, as well as the trade balance, was made.
Key Findings
- The UK’s Global Top Export Partners
- Top 5 Fastest-Growing Markets for Export
- Comparison of UK Exports to EU and Non-EU Countries
- EU-non-EUThe UK’s Global Top Import Partners
- Top 5 Fastest-Growing Markets for Import
- Comparison of UK Imports from EU and Non-EU Countries
- EU-non-EUThe UK’s Trade Surplus and Deficit with EU and Non-EU Countries
- Summary of the UK’s Total Trade
- Methodology
The UK’s Global Top Export Partners
The United States was the UK’s biggest export partner (£118.2 billion), followed by Germany (£55.4 billion), the Netherlands (£44.0 billion) and France (£42.1 billion).
Among the UK’s top five export partners were also Ireland (£38.3 billion) and China (£23.1 billion). Further, the UK exported a considerable amount to Italy (£19.7 billion), Switzerland (£19.6 billion), Belgium (£19.4 billion), and Spain (£17.6 billion).
Other important export countries were Japan (£14.3 billion), Hong Kong (£11.1 billion), and the United Arab Emirates (£10.6 billion).
While the United States remained the UK's biggest export market, eight out of the top ten export destinations were European countries. It is important to note here that Brexit will have a big impact on the trading industry in the UK, and the order of the top export destinations might look different after it.
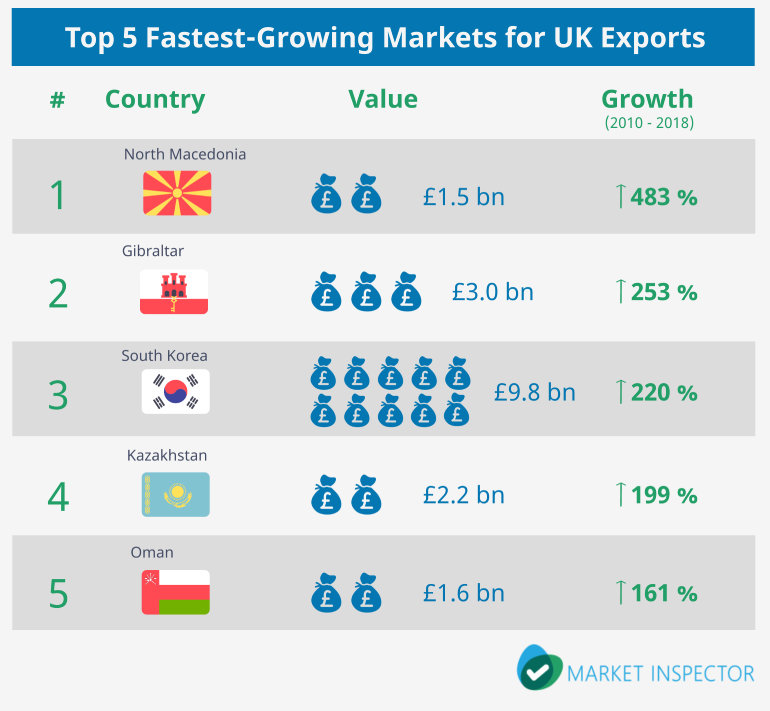
Top 5 Fastest-Growing Markets for UK Exports
According to the governmental data, top five fastest-growing markets for the UK exports between 2010 and 2018 were North Macedonia with 483% (£1.5 billion), Gibraltar with 253% (£3.0 billion), South Korea with 220% (£9.8 billion), Kazakhstan with 199% (£2.2 billion), and Oman with 161% (£1.6 billion).
Comparison of UK Exports to EU and Non-EU Countries
According to the data, between 2016 and 2019, the UK has exported more to non-EU than to EU countries, which can be seen on the graph below.
In the fourth quarter of 2018, the export value to non-EU countries was the highest with £91.2 billion. Yet, in the first quarter of 2019 it dropped to £85.6 billion.
The export to the EU reached its highest point in the fourth quarter of 2018 with £74.6 billion. The main export destinations were Germany with £55.4 billion, the Netherlands with £43.9 billion and France with £42.1 billion. However, the export to the EU dropped to £74.3 billion at the beginning of 2019.
The UK’s Global Top Import Partners
The interactive map below presents the UK’s import partners in 2018. According to the data, in 2018 the UK’s main import partners were Germany (£77.3 billion), the United States (£72.4 billion), the Netherlands (£49.1 billion), China (£45.4 billion), and France (£42.8 billion).
Other top import countries were Spain (£32.3 billion), Belgium (£29.1 billion), Italy (£24.8 billion), Ireland (£21.9 billion), Norway (£21.7 billion), Japan (£15.2 billion), Poland (£13.3 billion), and India (£12.5 billion).
In general, European countries sell more to the UK than non-EU countries.
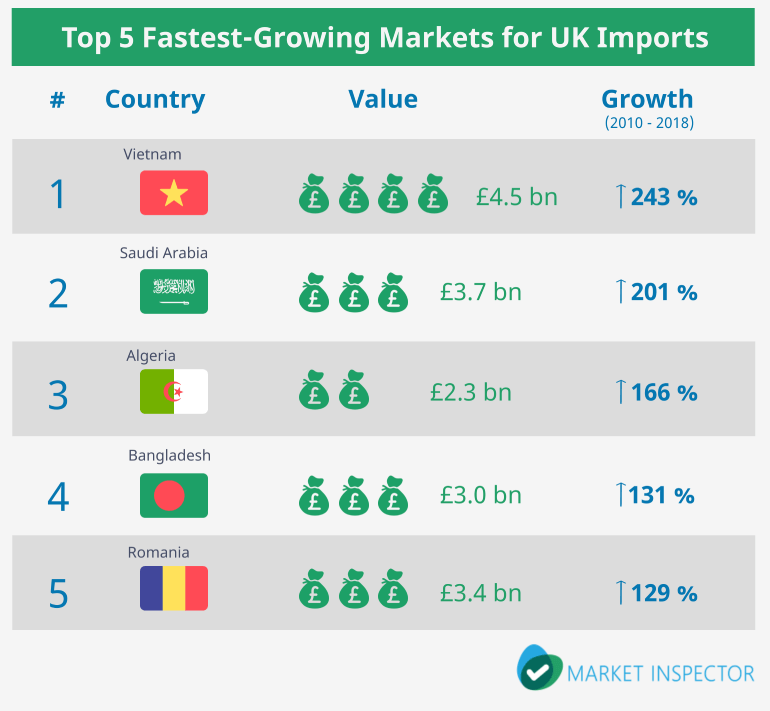
Top 5 Fastest-Growing Markets for UK Imports
According to the governmental data, the top five fastest-growing markets for the UK imports between 2010 and 2018 were Vietnam with 243% (£4.5 billion), Saudi Arabia with 201% (£3.7 billion), Algeria with 166% (£2.3 billion), Bangladesh with 131% (£3.0 billion), and Romania with 129% (£3.4 billion).
Comparison of UK Imports from EU and Non-EU Countries
According to the data, EU countries remained the UK’s main import partners, which can be seen on the graph below.
The import from EU countries increased from £89.9 billion in the fourth quarter of 2018, reaching its highest point during the first quarter of 2019 with £93.6 billion.
However, the statistics show that the import from non-EU countries is continuously growing in recent years. It widened from £72.7 billion in the first quarter of 2016 to £85.0 billion in the first quarter of 2018.
In 2018, the UK imported the most from the United States (£72.4 billion), China (£45.4 billion), and Norway (£21.7 billion). Yet, in the first quarter of 2019 the import from non-EU countries was the highest with £88.6 billion.
The UK’s Trade Surplus and Deficit: EU & Non-EU Countries
A trade surplus occurs when a country’s total value of exports is greater than the total value of imports. However, when the total value of imports exceeds the total value of exports, a country has a trade deficit.
- Continuing trade deficit might be detrimental to a country’s economy. To illustrate, when a country tends to import more than it exports, it might have a negative impact on employment level, interest rates, and currency value.
- It should be noted that trade deficit might be a mirroring of consumer preferences in some cases.
- Countries with persistent trade deficit tend to have more direct foreign investments.
The data shows that the UK had a surplus with non-EU countries in recent years. It was the highest in the second quarter of 2017 and accounted for £11.4 billion. However, in the first quarter of 2019, the UK had a deficit of -£3.0 billion with non-EU countries for the first time in the last few years.
In other words, in the first quarter of 2019 the UK imported more than it exported to non-EU countries, which can be seen on the graph below.
Furthermore, the statistics show that in the period from 2016 to 2019, the UK continuously ran a trade deficit with EU countries. Most importantly, in the first quarter of 2019, the country reached the highest deficit of -£19.3 billion. In fact, the UK has run a trade deficit each year since 1998.
A trade deficit widened from -£15.2 billion in the first quarter of 2018 to -£19.4 billion in the first quarter of 2019.
Summary of the UK’s Total Trade
In 2018 total trade made up £1.3 trillion, of which the import was £665.0 billion and the export £634.0 billion. The total trade with EU countries comprised £641.9 billion, and 657.2 billion with non-EU countries.
That means that the share of the UK exports and imports of the GDP was 61.8% in 2018. The export’s share was 30% of GDP, which shows a slight decrease compared to 30.4% in 2017 and 30.7% in 2011.
On the other hand, the import was 31.8% of GDP, which is also an increase from 31.6% in 2017 and from 23.7% in 2004. Further, the trade deficit was on the level of 1.5% of GDP in 2018.
Methodology
For this analysis of the UK imports and exports, Market Inspector used mainly the “Trade and Investment Core Statistics Book” from the UK’s Department for International Trade which was updated in October 2019. The report combines data from various governmental sources and presents it in a consistent manner.
The aim of the current research is to highlight the most significant trends regarding the UK’s export and import. In the report, the reader can also find information on the country’s top trading partners and fastest-growing markets.
In addition, the report also discusses the differences between the UK’s trade with EU and non-EU countries, and also includes an overview of the country’s deficits and surpluses.
For the calculation of the UK’s trade balance, the following formula was used, where a negative value represents the deficit in trade and a positive value the surplus:
Total Value of Exports - Total Value of Imports = Trade Balance
Dataset
The data collected for the report can be found in the respective sections below.
The UK's Global Export and Import Partners (2018)
The UK's Export to EU and Non-EU Countries (2016 - 2019 Q1)
The UK's Import from EU and Non-EU Countries (2016 - 2019 Q1)
The UK's Trade Balance with EU and Non-EU Countries (2016 - 2019 Q1)
We strive to connect our customers with the right product and supplier. Would you like to be part of Market Inspector?
