Top Business Activities by Region in the UK
How Well Do You Know Your Region?
Did you know that starting a business today in the UK, irrespective of the industry, company size, or location of your business, that there is over 80% chance that your turnover will be less than £500,000?
Strange as it may sound, this is the current reality of the business landscape in the UK. Market Inspector examined a recent report and found this to be the case.
We based our analyses on the data provided by the Office for National Statistics - the government body responsible for publishing data related to the health of economy across regional and national levels.
Methodology & Scope
First, we broke down the regions in terms of business concentration with respect to the entire UK. This helped us identify regions that are the best for business activity, as a higher concentration of businesses generally indicates more favourable business conditions.
Second, an industry-wide breakdown was carried out to understand the top performing industries in the UK. A high concentration of business in a particular industry usually means that the particular industry is more developed. It also means that there is a significant talent pool available in that sector.
Third, we classified the registered businesses in the UK into four main parts, namely micro (0-9 employees), small (10-49 employees), medium (50-249 employees) and large enterprises (250+ employees) in accordance with the OECD categories. This helped us understand the business landscape by size of the business.
Fourth, we went deeper to understand the best performing industry in the entire UK and explored its subcategories.
Fifth, we tabulated the region-wide and UK-wide breakdown for all industries and regions to give a complete picture of the current economic condition.
Finally, the scope of this article is to assess the current business landscape in the UK and communicate the same through a visual medium.
Business Landscape in the UK by Region, Activity and Size
This map highlights the most developed sector in every region and also the concentration of businesses according to the size. You can learn more by clicking each on the map below:
Business Breakdown by Region
The table below depicts the regions’ percentages in terms of concentration of businesses, irrespective of the industry. The London region is at the centre, with almost 19%, followed by South East region at 15.13%. East of England ranked third with over 10% share of the businesses in the UK. In contrast, the North East region has the lowest share of businesses at just 2.62%.
| # | Regions | Share of Businesses (%) |
|---|---|---|
| 1. | London | 18.95 |
| 2. | South East | 15.13 |
| 3. | East | 10.17 |
| 4. | North West | 9.74 |
| 5. | South West | 8.78 |
| 6. | West Midlands | 8.00 |
| 7. | Yorkshire and The Humber | 6.94 |
| 8. | East Midlands | 6.65 |
| 9. | Scotland | 6.54 |
| 10. | Wales | 3.84 |
| 11. | Northern Ireland | 2.65 |
| 12. | North East | 2.62 |
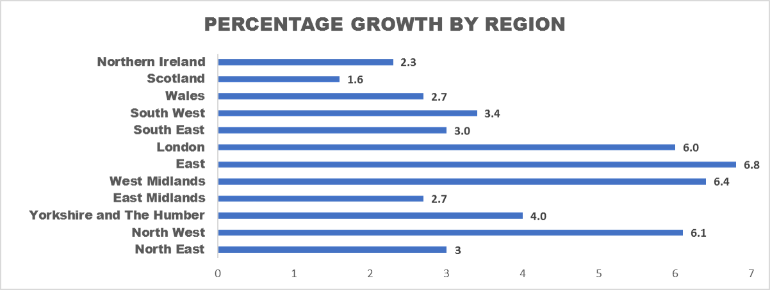
From the graph below we find that compared to last year, the East region grew the most with an 6.8% increase in new businesses. Also, it continues to be one of the top regions for all kinds of business activity in the whole of the UK.
London also recorded a healthy growth figure, but lagged behind those of West Midlands and North West regions. However, at the UK level, London has the largest share of businesses, approximately 19%. In contrast, Scotland has the lowest growth figure at just 1.6%. and encomposses merely 2.65% of all the businesses in the UK - the second lowest in the whole of the UK.
Business Breakdown by Activity
The following table highlights the biggest industries in the UK in terms of active businesses. Broadly, science and technology along with related professional work is the number one business concentration category, followed by construction and business administration.
| # | Broad Industry Group | Share of Businesses (%) |
|---|---|---|
| 1. | Professional, scientific & technical | 17.94 |
| 2. | Construction | 11.99 |
| 3. | Business administration & support services | 8.55 |
| 4. | Information & communication | 8.13 |
| 5. | Retail | 7.37 |
| 6. | Arts, entertainment, recreation & other services | 6.33 |
| 7. | Accommodation & food services | 5.63 |
| 8. | Production | 5.58 |
| 9. | Agriculture, forestry & fishing | 5.54 |
| 10. | Health | 4.50 |
| 11. | Transport & Storage (inc postal) | 4.10 |
| 12. | Wholesale | 3.87 |
| 13. | Property | 3.49 |
| 14. | Motor trades | 2.81 |
| 15. | Finance & insurance | 2.09 |
| 16. | Education | 1.81 |
| 17. | Public administration & defence | 0.27 |
From our analysis we find that Agribusiness is most concentrated in the South West region. Production, Construction and Motor Trade are highly concentrated in the South East. Transport and Storage (inc Postal) are booming in the West Midlands while public administration and defence are best in the East region. For every other business activity the the place to be is London.
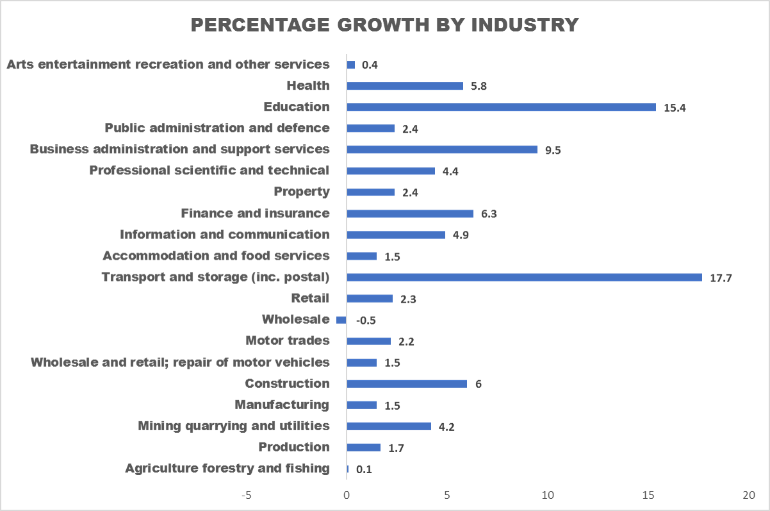
In terms of growth, the best performing industry was Transport and Storage (inc. postal) at 17.7%. In stark contrast, Wholesale shrunk 0.5% and Agriculture, Forestry and Fishing stalled with only 0.1% increase. UK wide data shows that the Education sector flexed its muscles by growing over 15% in 2017. From a region by region analysis we find that the number of businesses in the education sector accounts for less than 2% of all active businesses. However, London is an education hub and represents almost 20% of the education sector.
Business Breakdown by Size
As depicted on the map, almost 90% of business fall under micro-sized enterprises. About 8.5% are small-scale organisations and 1.5% are medium-sized businesses. Less than 0.5% of all businesses will qualify as large enterprises. This helps explain why you are more likely to have a turnover of less than £500,000. In addition, from a UK wide perspective London and South East are the regions with most dense business clusters.
Top Performing Business Activity in the UK
In every region except for Northern Ireland, Professional, Scientific & Technical is one of the top performing sectors. The breakdown of this sector is depicted in the table below:
| # | Disciplines | Percentage breakdown (%) |
|---|---|---|
| 1. | Activities of head offices; management consultancy activities | 38.64 |
| 2. | Architectural and engineering activities; technical testing and analysis | 21.34 |
| 3. | Legal and accounting activities | 16.01 |
| 4. | Advertising and market research | 11.64 |
| 5. | Other professional; scientific and technical activities | 10.43 |
| 6. | Scientific research and development | 1.13 |
| 7. | Veterinary activities | 0.80 |
With 38.64%, Head office and management consultancy activities lead this industry, followed by Architectural, Engineering, technical testing and analysis activities with approximately 22%.
From this we can infer that the UK has a highly developed skilled labour pool and is a knowledge driven economy. Future job seekers would do well to gain in-depth knowledge in their field of choice as specialised skillset is in great demand. London and South East have a high density of professional, scientific and technical organisations with over 20% of the UK companies being based in these two regions alone. Together they account for more than 40% of all the businesses in the UK in this sector.
Complete Tabular Breakdown - UK
Irrespective of the size of the business, London and South East continue to be the regions with the highest concentration of businesses. Between the two, London is the more influential centre of business activity.
With a healthy mix of different sectors and an equally developed labour market it makes sense for new businesses to migrate to London. Irrespective of the outcome of the BREXIT, London will continue to be a leading trade and business centre in the UK.
Table 1. Top Business Sectors in the UK
The table below depicts the broad industry groups percentages addressed to UK level. Highlighted cells represent the largest share of businesses active in that particular sector.
| Regions/ Broad Industry Group | North East | North West | Yorkshire & The Humber | East Midlands | West Midlands | East | London | South East | South West | Wales | Scotland | Northern Ireland |
|---|---|---|---|---|---|---|---|---|---|---|---|---|
| Agriculture, Forestry & Fishing | 2.66% | 7.89% | 7.80% | 7.45% | 8.35% | 8.09% | 0.48% | 7.95% | 16.28% | 9.35% | 11.63% | 12.06% |
| Production | 3.18% | 10.63% | 8.82% | 8.81% | 10.60% | 10.28% | 10.58% | 13.68% | 8.99% | 4.26% | 6.92% | 3.24% |
| Construction | 2.72% | 9.11% | 7.09% | 6.80% | 7.52% | 12.19% | 15.46% | 16.56% | 9.41% | 3.93% | 6.19% | 3.03% |
| Motor trades | 3.16% | 10.84% | 8.78% | 8.70% | 9.96% | 11.15% | 8.61% | 14.62% | 9.84% | 4.91% | 6.10% | 3.34% |
| Wholesale | 2.12% | 10.74% | 7.68% | 7.55% | 9.48% | 10.66% | 18.39% | 14.65% | 7.39% | 3.12% | 5.20% | 3.01% |
| Retail | 3.02% | 12.16% | 7.84% | 6.68% | 8.40% | 8.74% | 17.43% | 13.30% | 8.26% | 4.36% | 6.84% | 2.97% |
| Transport & Storage (inc postal) | 2.37% | 11.82% | 9.51% | 10.17% | 12.78% | 12.77% | 11.35% | 11.72% | 6.83% | 3.45% | 5.12% | 2.10% |
| Accommodation & food services | 3.89% | 10.55% | 8.38% | 6.54% | 7.52% | 8.38% | 14.98% | 12.54% | 9.96% | 5.66% | 9.04% | 2.56% |
| Information & communication | 1.49% | 7.05% | 4.48% | 4.53% | 5.87% | 10.05% | 31.20% | 20.34% | 7.37% | 2.08% | 4.73% | 0.82% |
| Finance & insurance | 1.82% | 12.12% | 5.94% | 7.72% | 5.93% | 8.47% | 25.95% | 13.93% | 7.64% | 3.08% | 5.38% | 2.02% |
| Property | 2.15% | 9.69% | 6.84% | 6.39% | 7.61% | 9.42% | 24.42% | 14.06% | 8.49% | 2.92% | 5.79% | 2.23% |
| Professional, scientific & technical | 2.52% | 9.08% | 5.58% | 5.63% | 6.84% | 9.84% | 25.13% | 17.24% | 7.61% | 2.59% | 6.78% | 1.16% |
| Business administration & support services | 2.32% | 9.90% | 6.32% | 5.87% | 8.29% | 11.55% | 22.62% | 15.49% | 7.79% | 3.35% | 5.44% | 1.05% |
| Public administration & defence | 3.08% | 7.48% | 8.53% | 12.31% | 9.09% | 17.97% | 1.26% | 16.43% | 16.50% | 6.08% | 0.70% | 0.56% |
| Education | 2.65% | 9.16% | 7.00% | 7.00% | 8.54% | 10.13% | 19.47% | 15.79% | 11.80% | 3.08% | 4.04% | 1.34% |
| Health | 2.83% | 11.02% | 7.51% | 6.80% | 8.77% | 9.36% | 19.98% | 14.03% | 8.01% | 3.73% | 5.62% | 2.34% |
| Arts, entertainment, recreation & other services | 2.94% | 9.56% | 6.69% | 6.05% | 7.16% | 9.32% | 20.53% | 15.46% | 8.39% | 3.97% | 7.37% | 2.56% |
Table 2. Best and Worst Performing Business Sectors in the Regions
The table below outlines the best and worst three business sectors in the regions, highlighted in green and yellow respectively.
| Regions/ Broad Industry Group | North East | North West | Yorkshire & The Humber | East Midlands | West Midlands | East | London | South East | South West | Wales | Scotland | Northern Ireland |
|---|---|---|---|---|---|---|---|---|---|---|---|---|
| Agriculture, Forestry & Fishing | 5.64% | 4.48% | 6.23% | 6.21% | 5.78% | 4.41% | 0.14% | 2.91% | 10.27% | 13.48% | 9.85% | 25.21% |
| Production | 6.79% | 6.09% | 7.09% | 7.39% | 7.39% | 5.64% | 3.11% | 5.05% | 5.71% | 6.18% | 5.90% | 6.82% |
| Construction | 12.48% | 11.20% | 12.25% | 12.26% | 11.26% | 14.37% | 9.78% | 13.12% | 12.84% | 12.25% | 11.33% | 13.70% |
| Motor trades | 3.39% | 3.13% | 3.56% | 3.68% | 3.50% | 3.08% | 1.28% | 2.72% | 3.15% | 3.59% | 2.62% | 3.54% |
| Wholesale | 3.14% | 4.27% | 4.29% | 4.40% | 4.59% | 4.06% | 3.76% | 3.75% | 3.26% | 3.15% | 3.08% | 4.41% |
| Retail | 8.52% | 9.21% | 8.33% | 7.41% | 7.74% | 6.34% | 6.78% | 6.49% | 6.94% | 8.37% | 7.71% | 8.26% |
| Transport & Storage (inc postal) | 3.71% | 4.97% | 5.61% | 6.27% | 6.54% | 5.14% | 2.45% | 3.17% | 3.19% | 3.68% | 3.21% | 3.25% |
| Accommodation & food services | 8.38% | 6.09% | 6.80% | 5.54% | 5.29% | 4.64% | 4.45% | 4.67% | 6.39% | 8.29% | 7.78% | 5.44% |
| Information & communication | 4.64% | 5.88% | 5.25% | 5.54% | 5.96% | 8.04% | 13.39% | 10.93% | 6.83% | 4.40% | 5.88% | 2.52% |
| Finance & insurance | 1.45% | 2.60% | 1.79% | 2.42% | 1.55% | 1.74% | 2.86% | 1.92% | 1.82% | 1.67% | 1.72% | 1.59% |
| Property | 2.87% | 3.47% | 3.44% | 3.35% | 3.32% | 3.23% | 4.50% | 3.25% | 3.38% | 2.65% | 3.09% | 2.93% |
| Professional, scientific & technical | 17.28% | 16.72% | 14.43% | 15.20% | 15.35% | 17.37% | 23.79% | 20.45% | 15.55% | 12.07% | 18.58% | 7.87% |
| Business administration & support services | 7.58% | 8.69% | 7.79% | 7.55% | 8.87% | 9.71% | 10.21% | 8.75% | 7.59% | 7.45% | 7.11% | 3.40% |
| Public administration & defence | 0.32% | 0.21% | 0.33% | 0.50% | 0.30% | 0.47% | 0.02% | 0.29% | 0.50% | 0.42% | 0.03% | 0.06% |
| Education | 1.83% | 1.70% | 1.83% | 1.91% | 1.93% | 1.80% | 1.86% | 1.89% | 2.43% | 1.45% | 1.12% | 0.06% |
| Health | 4.87% | 5.09% | 4.87% | 4.61% | 4.94% | 4.14% | 4.75% | 4.17% | 4.10% | 4.37% | 3.87% | 3.97% |
| Arts, entertainment, recreation & other services | 7.10% | 6.21% | 6.10% | 5.76% | 5.67% | 5.80% | 6.86% | 6.47% | 6.05% | 6.53% | 7.13% | 6.11% |
Table 3. Turnover across Regions
The table below depicts the turnover landscape in terms of percentages reported in the regions. The turnover is categorised into three main parts. Namely, less than £500 (‘000), between £500 (‘000) and £4999 (‘000) and more than £5000 (‘000).
| Turnover (£)/ Regions | <500K (£) | 500K-4999K (£) | >5000K (£) |
|---|---|---|---|
| North East | 84.38% | 13.48% | 2.15% |
| North West | 84.03% | 13.75% | 2.21% |
| Yorkshire and The Humber | 83.65% | 14.10% | 2.26% |
| East Midlands | 84.07% | 13.80% | 2.12% |
| West Midlands | 83.15% | 14.67% | 2.18% |
| East | 83.97% | 13.91% | 2.12% |
| London | 83.66% | 13.65% | 2.70% |
| South East | 84.31% | 13.54% | 2.15% |
| South West | 85.32% | 13.02% | 1.66% |
| Wales | 85.93% | 12.41% | 1.66% |
| Scotland | 84.29% | 13.73% | 1.98% |
| Northern Ireland | 83.22% | 14.67% | 2.11% |
We strive to connect our customers with the right product and supplier. Would you like to be part of Market Inspector?
